Technical chart analysis (TA) is bullshit!

Too long; didn’t read:
- Technical chart analysis (TA) tries to predict future price movements based on past data in order to set buy / sell times when trading as optimally as possible.
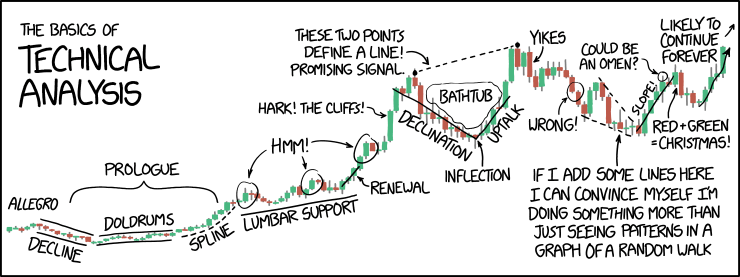
- TA traders draw lines in charts and accompany them with important-sounding wordings and analyses.
- Any trading advice based on these and other technical indicators is 99.9% nonsense and about as useful as the daily horoscope in the tabloid press.
- Traders who made a profit with such strategies are the result of normal probability distributions.
Preliminary remark
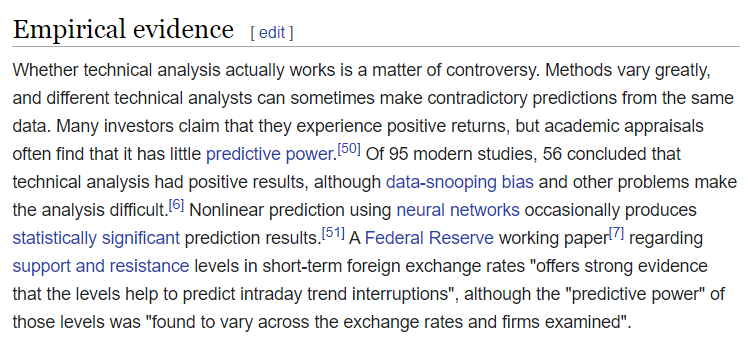
The question whether technical chart analysis (TA) for price forecasting under certain conditions brings a small advantage over pure guessing has already been investigated in dozens of studies:
I don’t get my hopes up that I can prove anything with this article, that various studies before me have already failed to do. And I am quite sure that no chart trader will stop drawing lines on his charts because of this article.
My main point is to educate. Because, although no robust evidence exists for or against the efficiency of trading based on chart analysis, there are thousands of traders, Youtubers, Twitter chart artists & Co, but very very few who counter this nonsense.
Especially in the crypto space, the misconception that you can make money with technical analysis seems to be extremely prevalent.
What is chart analysis (technical analysis) all about?
In technical chart analysis, traders try to identify signals and patterns purely on the basis of price movements (candles) and trading volume, which should provide information about whether it is a favorable time to buy or sell.
You can recognize technical analysts by the following phrases that everyone has probably heard and accepted because they sound kind of professional:
“Bitcoin has fallen below the 200 day line. If it doesn’t go straight back up now, the next support is not until $ XXX”
“A classic cup and handle formation is forming. A bullish signal for the price!”
“The downward channel has been broken to the upside. If trading volume picks up now, we’ll see more upside.”
or feel free to be a bit more “convincing”:
“So far, the price is doing great at the Elliot Waves to the next breakout of the SKS . CME Gap was also filled. On January 11, we bounced super at the 0.786 in the Fibo, so now we can focus on the 0.618, which is in the next resistance and at the 200 MA at ~9159. However, this still needs to be confirmed. Expected correction of breakout from the trend channel at the next EW.”
Accompanied with colorful charts full of lines and triangles.
At this point, I should also clarify the following, so that technical analysts do not feel misunderstood:
The point of technical analysis is not to predict the price, but only to estimate the probability of occurrence for certain movements as best as possible.
If, based on technical analysis, a trader could figure out that the probability is 51 percent that the price will go up and 49 percent that it will go down, he could (assuming potential profit and loss balance each other out) exploit thousands of such small probability advantages over time and make money.
That is nothing else as if someone with a rigged coin that lands on head 51% of the time would bet on head against you. Sure he would lose in between because tails comes up, but over time the positive expected value (“edge”) of that coin flip would ensure that he makes a profit in the long run.
This is exactly what TA traders (for Technical Analysis) think they can do and why they make profit. Having an “edge” in trading. They don’t!
By the way, technical analysis should not be confused with fundamental analysis, which analyzes investment objects based on economic / business data.
In this article I would like to set up a few theses and then support them with arguments, examples and common sense.
Thesis 1: Price depends on millions of individual factors in the market that add up to create a random* price movement.
This point is probably the most difficult to grasp and the main reason why people think they can make trading profits with chart analysis. After all, if the price is random, that means by definition that past data has no effect on the future and chart analysis is hokum. If a coin toss comes up heads 20 times in a row, the probability that the next toss will come up heads is still 50%.
*What does “the price is random” mean?
This does not mean that it is random whether the price goes up or down. But rather that the information leading to the movement arrives by chance: Emma Smith decides to buy bitcoin, a veteran bitcoiner sells because he needs money, a trader thinks he sees a pattern and trades, a high frequency trading bot executes an order, Iran bans bitcoin, a miner needs to pay his electricity bill and sells, …. Millions of unpredictable individual decisions lead to the direction the price will move next.
Example: Suppose there is a dice game where you win 1 euro per roll. But if you roll a 6, then you have to pay 5 euros. The probability at any time that the chart with your wining goes up is much higher than that it goes down. Still, there is no way to make a long term profit in this game, because the expected value is zero (5 x 1 + 1 x (-5)) / 6 = 0
Thesis 2: Because the price moves randomly, there is no way to consistently beat the market
When I say “TA traders don’t make a long term profit” I mean not that they are left with more money (say Dollars) at the end of the year than at the beginning. But that they have to earn more than the market. And that over a long enough period of time so that chance or luck no longer play a role.
Example 1:
A trader who trades international stocks and turned $10K into $12K dollar in 2021 is not a winner! Because the global stock index has risen 25% in the same time.
Example 2:
A trader who only trades Bitcoin up an down movements can not measure his success in dollars. He is only a winner if he owns more BTC and dollar at the end of the year than at the beginning.
Of course there are traders who are winners even according to these criteria. But this does not mean that these people have beaten the market. Only if a trader can prove over several years or thousands of transactions that he makes better decisions than the market, my hypothesis would be disproved. But such evidence simply does not exist.
On the contrary, just how common this error is in determining winners can be seen from the fact that over a 10-year period 99 (!) percent of actively managed equity funds worldwide (net of fees) underperformed the underlying benchmark (Source). After one year, you might still have thought that 46 percent of funds were winners.
So it’s damn hard to beat the market consistently. For example, in the crypto bull run in 2017, there were virtually only apparent winners, as everyone who bought cryptocurrencies made massive book profits (in dollar!). But the crucial question is, did he make more profit than a monkey throwing darts at the top 100 on Coinmarketcap? And can he repeat that every year?
Thesis 3: All chart traders who have taken profits in the past are the result of normal probability distribution
“I know one guy who has been doing this successfully for years”
or
“There are thousands of traders who can make a living doing this”.
Why are these not valid arguments? For the following three reasons that are valid either alone or in combination:
1. Whether a trader has made a profit or beaten the market are two different pairs of shoes (see examples above). Determining this is not so easy depending on the market and is often not considered.
2 The fact that there are big winners even in random games with no advantage to the player is a statistical necessity and follows from the probability distribution. For a coin toss, for example, this is the binomial distribution
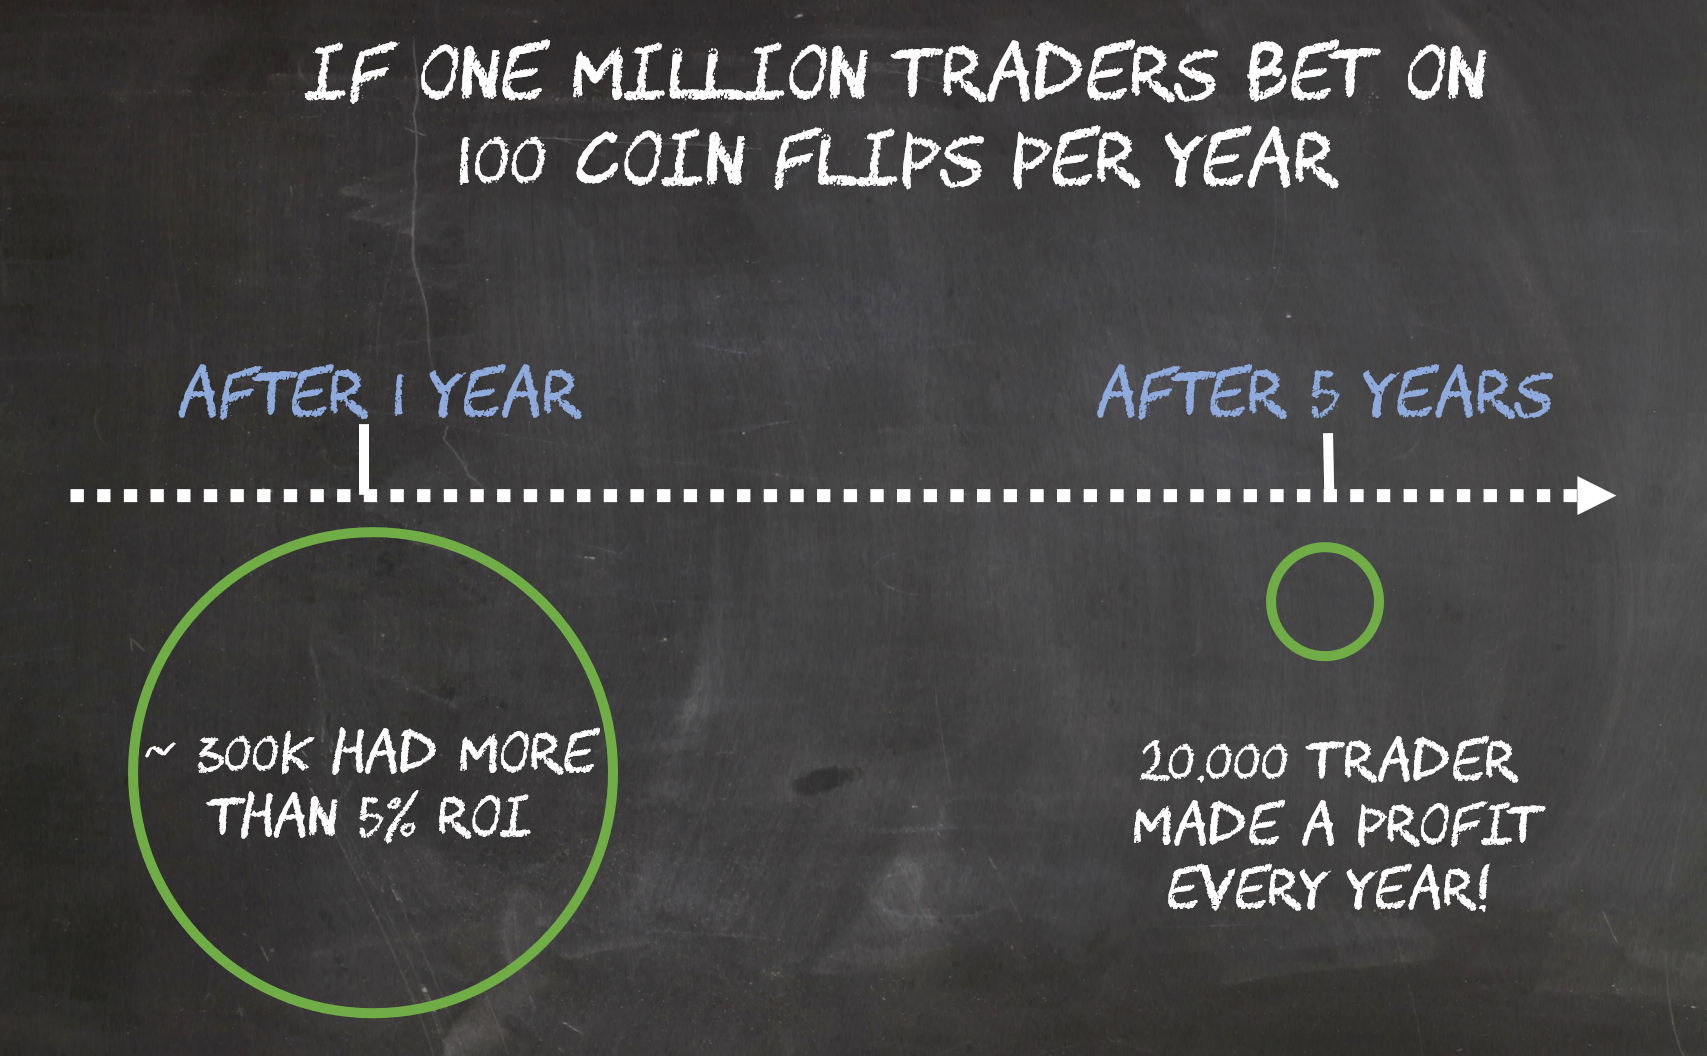
Example: Suppose 1,000,000 traders bet the same amount on a coin toss 100 times in a year. If heads comes they win a bet, if tails they lose it. A completely fair game that depends only on chance.

According to binomial distribution, after one year there are about 460,000 traders who are in profit! And about 308,000 have "earned" more than 5% return.

After 5 years, there are about 20,000 traders who have finished each year in profit! And about 2,700 traders who were up more than 5% every year!

I'm sure a large portion of those 2,700 traders would be on YouTube or sell training courses where they teach their obviously superior coin flip strategy....
3. The sample size is too small. I’ve heard of supposed chart analysts making only a dozen trades per year (when the chart is particularly clear). Even a few hundred trades per year is far too few to consider the result statistically relevant.
This is statistically the same as if I were to go to the casino once a month and place just one bet in a game of roulette on all numbers except two. In all likelihood, I’ll walk out of the casino with a profit every month because the likelyhood is small that I lose if I do this just once a month.
More arguments against trading based on TA
The maximum possible advantage is too low
Suppose the DOW JONES (i.e., the market) grows by 10 percent in a year. If a trader has an edge over the market of 5% (which is a lot according to the few studies that have found any effectiveness at all), that means a trader with a capital of 100,000 dollar has earned 10,000 dollar due to the DOW JONES gains and 500 dollar due to his trading skills. To be able to live from trading, he would have to have at least 100 times as much capital (10 million dollar would give him a 50,000 dollar income).
Actually successful chart traders do not give training courses
The few chart traders who are actually (statistically relevant) successful (can’t rule them out) would put all their energy into using this money printing machine themselves. The moment you pass on the knowledge to other traders and they can use it, the advantage is gone. Hence, another controversial statement:
Everyone who posts charts on Twitter, has a TA Trading Youtube Channel, mentoring lessons or sells books:
– Either doesn’t know better themselves.
– Lies to themselves consciously or unconsciously.
– Or consciously profits from others not knowing.
An advantage through technical analysis contradicts the market efficiency hypothesis
Admittedly, a rather weak argument. The Market Efficiency Hypothesis (EMH) states that the price already contains all the information that is available in that market. That includes the information that could give an advantage to a TA trader. I am of the opinion that the markets are not that efficient, so there are bound to be small information advantages. By the way, the EMH also supports the “random walk hypothesis” which says that prices occur randomly.
Every advantage humans could detect from charts, computers could detect and exploit millions of times better.
Computers can evaluate millions of charts, calculate indicators and recognize patterns in a fraction of a second. Even better, they can classify possible patterns recognized by TA traders and check for past data whether they would have led to success (“backtesting“). There is no reason why a human should be better at this, because according to the definition of technical analysis, fundamental data (what is happening in the environment of the traded asset) plays no role in the decision.
So a computer has the same information as a human, it can process it better, is more disciplined and is not subject to emotional fallacies and biases. But a “professional trader” is supposed to have an advantage over this??
And indeed: computer programs (trading bots) are used extensively to trade automatically based on chart signals. This is a highly complex topic where even the best models can not really prove that they permanently beat the market. Because if they could, they would be money printing machines.
Trading fees eat up profits
Traders who trade extremely heavily (several million per month) often pay very little and sometimes even no trading fees. For all others the normal fees of the exchanges apply. Per trade this is in the per mille range, but with thousands of trades per year which are necessary to be able to make a statistically valid statement at all, this adds up quickly. Exchanges are the only ones who earn from chart traders…
The only argument for TA
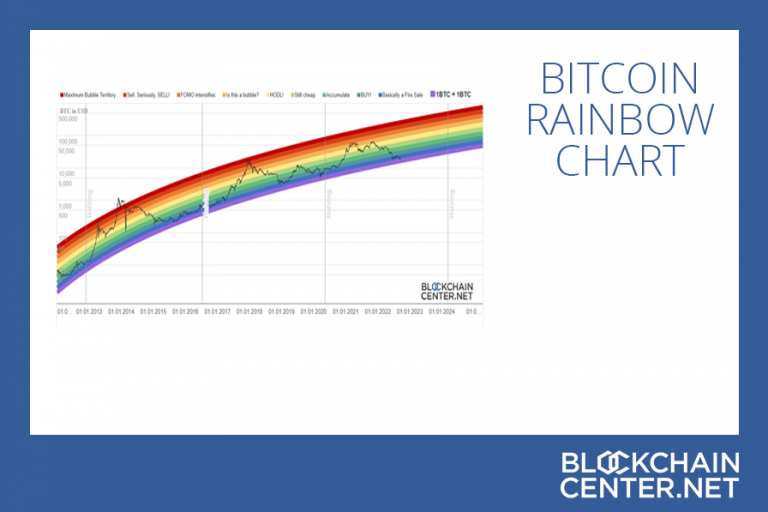
If there were indicators that were so clear that the entire market saw them the same way, that could cause them to become self-fullfilling prophecy. Bitcoin’s well-known stock to flow model (or our Rainbow Chart) are examples of this. As a rule, however, virtually all chart analysis is highly subjective, as there are infinite time periods and intervals to analyze, and different conclusions are drawn depending on how one looks at it.
Common rebuttals:
“But trading is a zero-sum game, if there are bad traders, there must be good traders who profit from it”
Bad traders do exist, without question. However, it is not due to bad buying and selling timing. The reason are typical investment mistakes which would lead to a loss even in the above fair coin toss game:
Example:
If I only have 1,000 dollars available and play the coin toss game with 100 dollars per coin toss, the probability is literally 100% that I lose everything at some point! The same applies to trading. The reason for this is statistical variance.
Add to this a number of emotional investment errors (Sunk Cost Fallacy, Loss Aversion, Emotional bias…) and you see why there are bad traders that have nothing to do with buying/selling timing.
“How can you argue against technical analysis when you obviously don’t know anything about it?”
That’s right. I have no idea about the “tools” of technical analysis. Neither do I know anything about astrology or laying tarot cards and yet I can make a judgment about it. It does not matter that I have no idea about TA. My theses are based on the fact that the price movements arise from coincidentally arriving events. This thesis cannot be refuted. Very many studies have shown that. But in games of chance, by definition, there can be no strategy / tactic that gives a long term advantage.
Conclusion
There is simply no clear evidence that trading can achieve an advantage over the market based on technical analysis.
All statements made here build on the basic hypothesis that the price chart follows a pattern based on random events (random walk hypothesis).
According to this logic, chart analysis is, at best, the result of ignorance or misunderstanding of statistical relationships. At worst, it’s a rip-off. After all, with training, mentoring and the sale of newsletters and books, chart analysts (as opposed to trading) actually can make money!
Clever-sounding wording and complicated-looking lines, patterns and indicators in charts have led many people to believe this type of analysis is legitimate and stopped questioning it.
I hope that with this article we can at least somewhat help to set the ratio between proponents and critics in a measure that corresponds to the scientific consensus in this regard.
In this spirit:
Technical Analysis (TA) is bullshit!