
Cryptocurrency Correlation Tool
| BTC | ETH | BNB | ADA | XRP | LTC | XMR | DOGE | SOL | DOT | AVAX | GOLD | SP500 | |
|---|---|---|---|---|---|---|---|---|---|---|---|---|---|
| BTC | 1 | ||||||||||||
| ETH | 0.88 | 1 | |||||||||||
| BNB | 0.68 | 0.74 | 1 | ||||||||||
| ADA | 0.67 | 0.77 | 0.69 | 1 | |||||||||
| XRP | 0.38 | 0.47 | 0.37 | 0.63 | 1 | ||||||||
| LTC | 0.64 | 0.71 | 0.66 | 0.67 | 0.36 | 1 | |||||||
| XMR | 0.66 | 0.63 | 0.54 | 0.5 | 0.25 | 0.57 | 1 | ||||||
| DOGE | 0.57 | 0.67 | 0.57 | 0.64 | 0.36 | 0.66 | 0.46 | 1 | |||||
| SOL | 0.64 | 0.68 | 0.59 | 0.73 | 0.41 | 0.56 | 0.43 | 0.48 | 1 | ||||
| DOT | 0.71 | 0.79 | 0.69 | 0.79 | 0.46 | 0.67 | 0.56 | 0.65 | 0.69 | 1 | |||
| AVAX | 0.65 | 0.72 | 0.67 | 0.71 | 0.42 | 0.65 | 0.57 | 0.61 | 0.66 | 0.79 | 1 | ||
| GOLD | 0.24 | 0.21 | 0.13 | 0.14 | 0 | 0.17 | 0.16 | 0.15 | 0.15 | 0.12 | 0.15 | 1 | |
| SP500 | 0.26 | 0.32 | 0.24 | 0.31 | 0.25 | 0.28 | 0.24 | 0.27 | 0.21 | 0.26 | 0.28 | 0.03 | 1 |
This is an interactive tool. You can click on the values in the table to see the trend or change the timeframe above the table.
Correlation over time: SP500 vs. BTC (Rolling 180 days)
Is Bitcoin An “Uncorrelated Asset”?
- We investigated the correlation between the returns of some Cryptocurrencies, gold and big stock indices (S&P 500 and Dow Jones).
- The Pearson correlation coefficient shows the extend to which two data sets (in this case: daily returns) are related.
- It takes values between -1 and 1:
1 positive correlation (if one goes up, the other one goes up as well) 0 not correlated -1 negative correlation (if one goes up, the other one goes down)
Key Takeaways
- Gold is not correlated with any of the other data sets including Bitcoin
- Cryptocurrencies amongst each other are positively correlated
- Bitcoin and the S&P 500 showed no correlation until the Coronacrisis hit both stocks and Bitcoin hard, resulting in a growing correlation. Over time the correlation grew stronger.
Is Bitcoin An “Uncorrelated Asset”?
Some bitcoiners like to say “Bitcoin is an uncorrelated asset”, implying that its price movement is completely decoupled from the price movement of other asset classes. Investing in combinations of uncorrelated assets can reduce the overall risk in a portfolio and event boost the overall return. But is that really the case? With this tool, data is analyzed with the aim to back up or dismiss the claim.
The Pearson Correlation Coefficient
The Pearson correlation coefficient is a beneficial mechanism to measure this correlation and assess the strength of a linear relationship between two data sets. It takes values between -1 and 1. -1 is a strong negative correlation, 0 implies no correlation at all (uncorrelated) and +1 stands for a strong positive correlation.
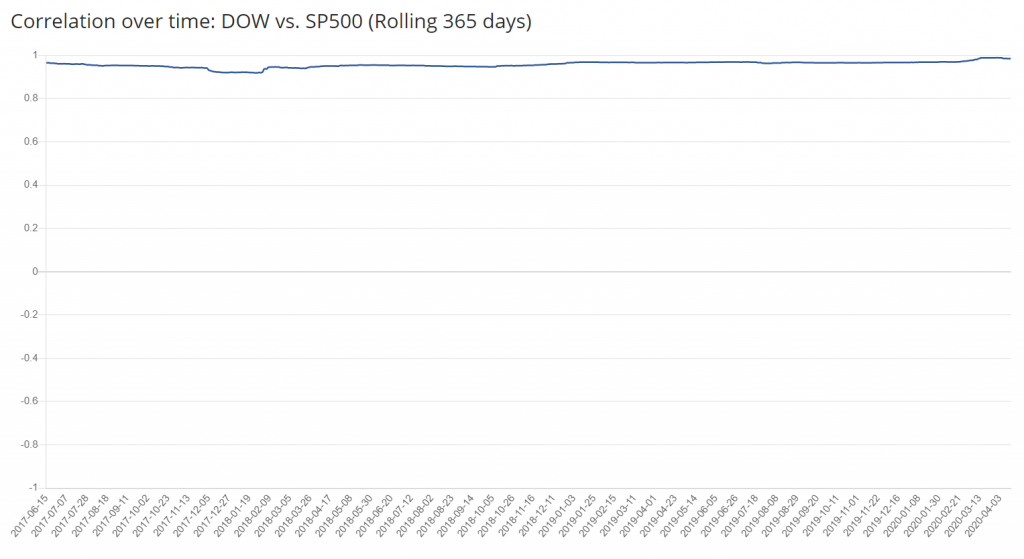
Looking at this tool, a coefficient of 1 essentially equates: if one asset goes up, the one we are comparing it to tends to go up, as well. This also happens vice versa. A good example for a coefficient of almost 1 is the comparison between the S&P 500 and the Dow Jones stock index. Both track the performance of blue-chip stocks. Consequently, it comes as no surprise that the correlation chart for S&P vs. Dow Jones looks like the following:
A Pearson correlation of 0 means there is not correlation between the two assets whatsoever.